Crosser + UNS - Run analysis on windowed data
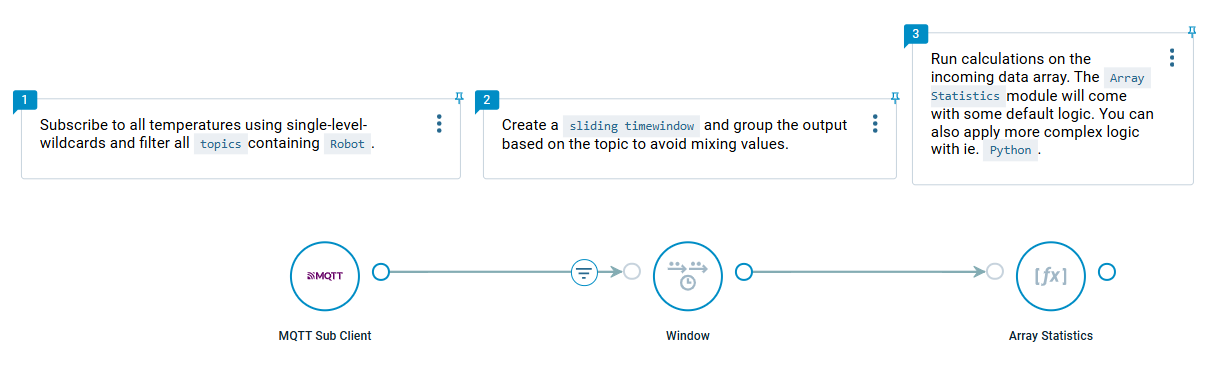
To analyze data from an UNS (Unified Namespace) in Crosser, first use the Window module to create a sliding time window that groups incoming data over a defined period or count. Then, connect the Array Statistics module to compute key metrics—such as min, max, stdDev, sum, average, and their positions—on each data array within the window. Finally, route the output to a logger, database, or alert system to monitor real-time trends or detect anomalies based on these statistics.
In the example below we want to apply this concept in order to monitor the temperature of all Robots.
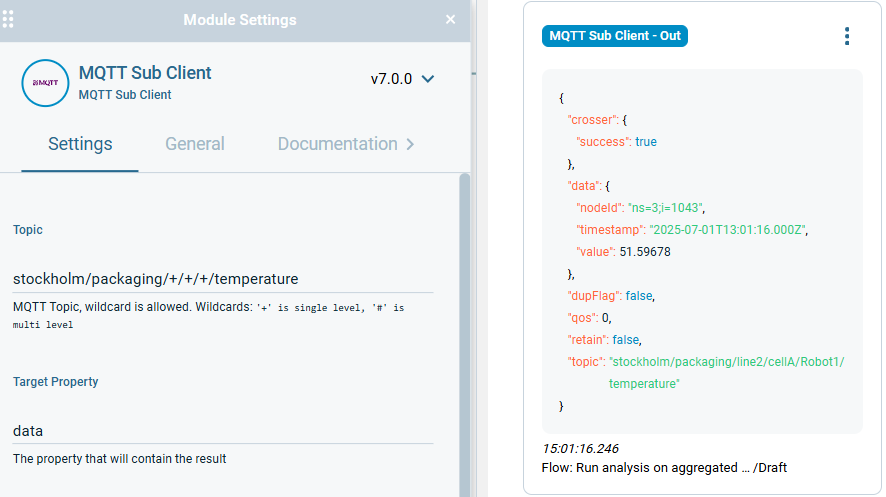
First we set up a subscription using single-level wildcards. This will subscribe to all temperatures in the packaging topic.
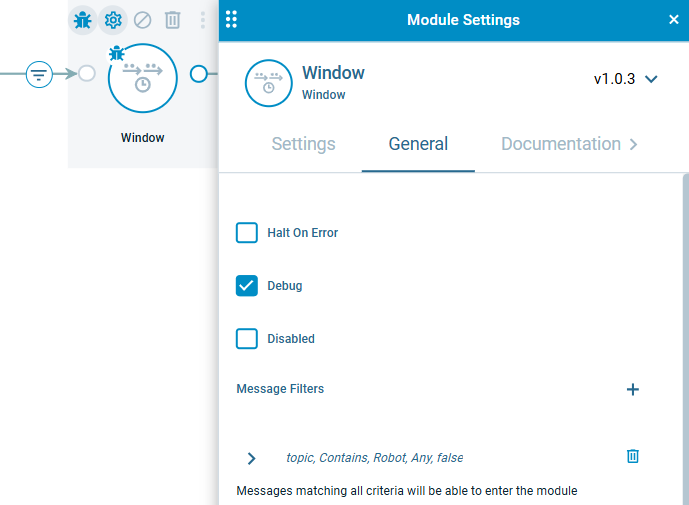
Next we use the ‘Window’ module to create a sliding time window that shifts every second. Important here is to set the Group Property’ to ‘topic’ to avoid mixing up values. In addition we add a filter to the module to only allow messages to pass where the topic contains ‘Robot’. This will allow us to only analyse the data for our Robot, ignoring other asset types.
Lastly we add the ‘Array Statistics’ module and configure it to calculate the statistics for the value property ‘value’.
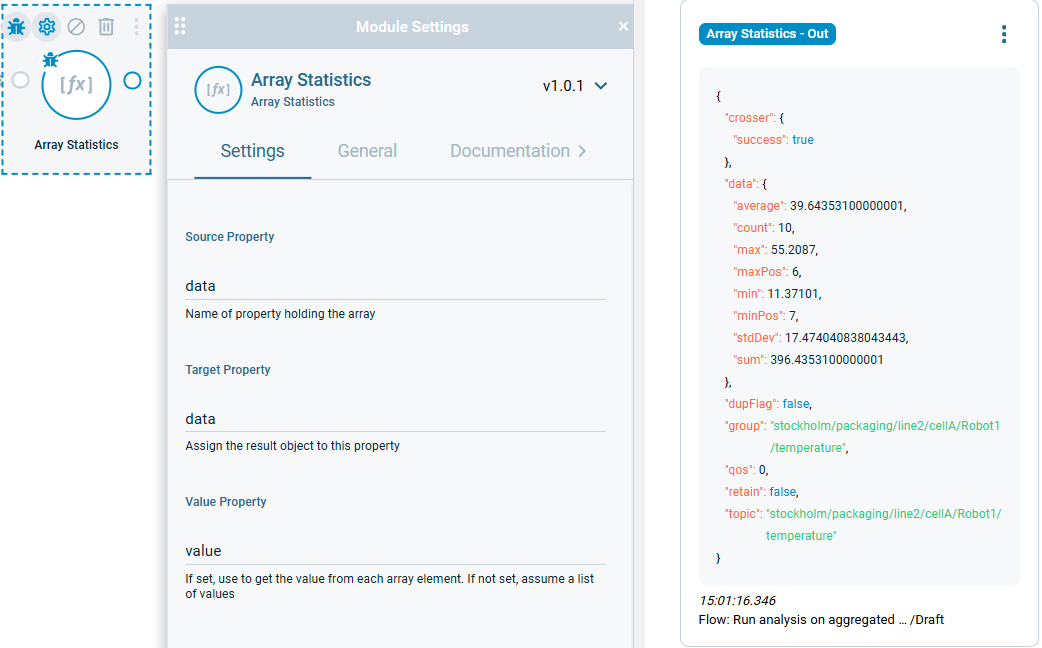
Note: The result can now be used to store it in a database, act on the data or send out notifications in case a value reaches a certain threshold.
